Performance
What a Performance Test Really Proves | ASME PTC 46 & PTC 22 in Plain Words
Performance testing explained by an engineer who has led tests on the 900 MW BQPS-III and 1,263 MW PTPL plants: what ASME PTC 46 and PTC 22 actually measure, how a test day runs, and why corrections make the verdict fair.

Ask anyone running a power plant how much it generates, and how efficiently, and you'll get a confident answer. The control room displays show megawatts. The fuel bills arrive every month. Over the years, a comfortable set of numbers settles into everyone's head. The uncomfortable truth is that most of those numbers are beliefs, not measurements. A performance test is what turns belief into evidence.
Testing is a large part of my work at OMS. I led the performance testing of the 900 MW BQPS-III combined cycle plant, and I led the test team at the 1,263 MW PTPL plant — two of the largest machines on Pakistan's grid. In both cases the final reports went to the regulator and the power purchaser: NEPRA in one case, CPPA-G in the other. When numbers carry that kind of weight, "the control room says so" is not good enough.
Why Test at All?
A formal performance test answers three questions ordinary operations cannot. First, acceptance. When a contractor hands over a new plant, or a major component is replaced, somebody has to prove the machine delivers what the contract promised. Second, baseline. Tariffs, capacity payments and degradation tracking all need a trustworthy starting point: what the plant could do, measured properly, on a known day. Third, disputes. When the owner believes the plant has lost output and the operator believes it has not, a test settles the argument with instruments instead of opinions.
Two Codes, Two Questions
The ASME Performance Test Codes are the rulebooks that make these measurements comparable everywhere in the world. Two of them matter most on a combined cycle plant.
PTC 46 covers overall plant performance. It draws a boundary around the entire station and asks one question: how much fuel energy goes in, and how much net electrical energy comes out? Output and heat rate are judged at the boundary, with the whole plant treated as a single machine.
PTC 22 covers the gas turbine alone. It asks the narrower question: what does this turbine, by itself, produce and consume? Owners use it when a turbine is accepted, replaced or overhauled and its individual health has to be separated from the rest of the plant's.
Neither code is a suggestion. Each one prescribes the instruments, the test conditions, the calculations and — just as importantly — how the uncertainty of the result must be stated.
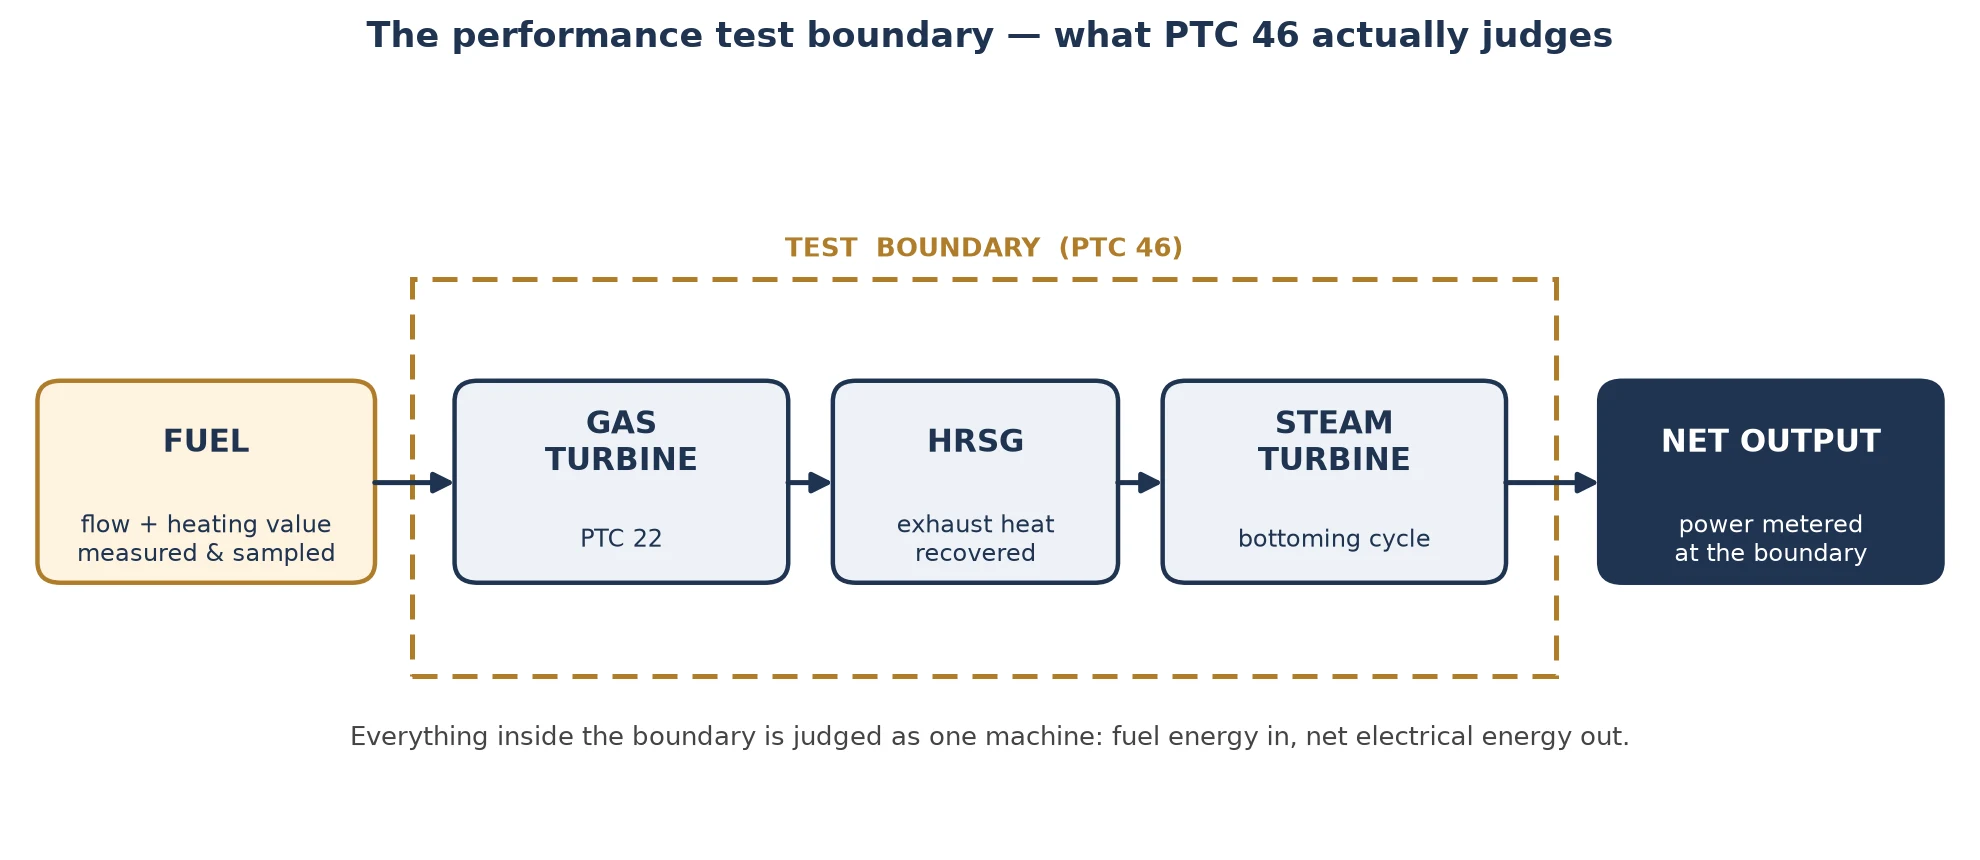
The test boundary: everything inside it is judged as one machine.
How a Test Day Actually Runs
A good test is won or lost before the plant ever reaches full load. The procedure comes first, agreed in writing: the boundary, the operating mode, the instruments, the correction method, the witnesses. Every argument that could possibly arise later is settled on paper, while nobody yet knows the result.
On the day itself, the plant's own control-room instruments are not trusted for the verdict. Test-grade instruments, calibrated before and after the test, are installed for the critical measurements: pressures, temperatures, flows, and the electrical output at the boundary. Fuel is sampled and its heating value determined in a laboratory. That matters because a small error in heating value becomes a large error in heat rate. The plant is then held steady at the test load while data is recorded run after run. If conditions drift outside the agreed tolerances, the run is discarded and repeated. Representatives of the owner, the contractor and the purchaser watch the same screens. Nobody gets to be surprised by the arithmetic afterwards.
Corrections: Where the Fairness Lives
No test day ever matches the conditions written in the guarantee. The guarantee refers to a reference day — a defined ambient temperature, pressure, fuel composition and load. A summer afternoon in Karachi is none of those things. And a gas turbine that produces less on a hot day is not a failing machine; it is a machine obeying physics.
So the measured results are corrected to the reference conditions, using the manufacturer's correction curves, exactly as the agreed procedure prescribes. Temperature, pressure, humidity, fuel properties, power factor — each effect is accounted for openly. This is the part outsiders most often misunderstand. Corrections are not a fudge to make numbers look better. They are the mechanism that makes the comparison fair, and they cut both ways: a test run on a cold morning gets corrected down just as firmly.
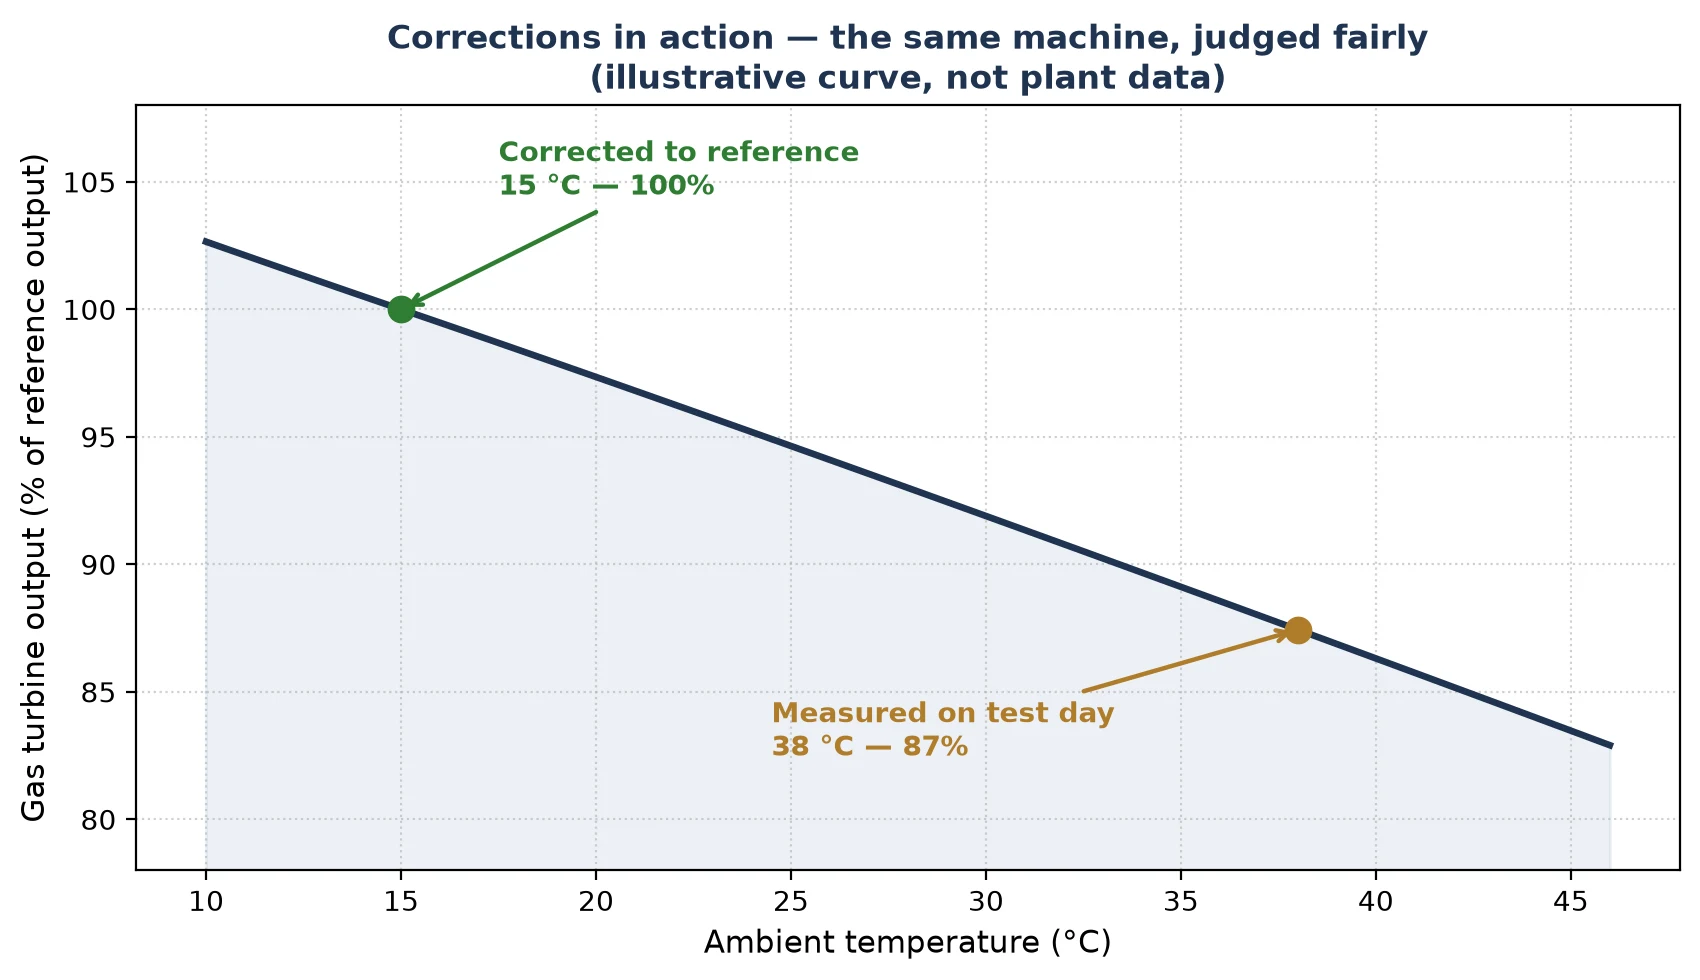
Corrections in action — the same machine, judged fairly. Illustrative curve, not plant data.
The codes are equally strict about uncertainty. Every measurement carries error, and a PTC test report states the uncertainty band around its result rather than pretending the number is exact. That honesty is what allows two parties with opposing commercial interests to sign the same report.
What the Final Report Settles
When the calculations are done, the report places two numbers side by side: what was guaranteed, and what was measured and corrected. On an acceptance test, that comparison decides whether the plant is taken over, and on what terms. On a regulatory test — the kind I have led at BQPS-III and PTPL — the numbers enter the official record that tariffs and capacity are built on. For the plant's own engineers, the report becomes the reference against which every future loss of output is measured.
The Takeaway
Three things make a performance test worth its cost. Agree the procedure before anyone knows the result. Treat instrument calibration as the test itself, not as paperwork around it. And respect the corrections: they are how a machine tested on the worst day of summer gets judged by the same standard as one tested in winter. Do those three things, and a performance test stops being a ceremony. It becomes what it is supposed to be — proof.
Related tools and reading: Performance Correction Calculator · Degradation Tracker · Orifice Flow Calculator · From Heat Rate to Tariff. · Performance Testing: The Complete Guide
Further Reading
ASME PTC 46 — Overall Plant Performance (ASME) — the publisher's page for the code that governs the plant-level tests described in this post.
Saad Hafeez is a Chartered Mechanical Engineer and Deputy General Manager – Power Plants at OMS, specialising in plant performance testing, maintenance management and project management across Pakistan's power sector.
More from the blog
 ProjectsHow Owners Evaluate Bids — Inside a Techno-Commercial EvaluationA bid that passes pre-qualification, a technical read of the method, prices normalised to one basis and a whole-life view may still not be the cheapest — but it will be the one you can defend, to a board, an auditor, and the plant that has to live with it.Read post →
 MaintenanceMinor at 30K, Major at 60K — The Rhythm of Engine OverhaulsAn engine wears out on hours, not dates. The 30,000-hour minor is a checkpoint whose measurements shape the 60,000-hour major — and across a 32-engine fleet, sequencing, spares and records are what make the programme work.Read post →
 EnergyWhy the Grid Struggles at 7 pm: Peak Demand, ExplainedThe evening peak is not a shortage of plants. It is a timing problem: demand climbs as solar falls away, and the system must ramp faster than its slowest plant can move — buying the last megawatts from the dear end of the merit order.Read post →