Energy
Why the Grid Struggles at 7 pm: Peak Demand, Explained
Pakistan's grid does not struggle at 7 pm for lack of power stations. It struggles on timing: demand climbs just as solar output falls away, net load ramps faster than steam plant can follow, and the marginal megawatt comes from the dear end of the merit order.
Pakistan does not run short of power stations in the evening. It runs short of cheap power at the exact hour everyone wants it. That explains most load-shedding frustration: lights can go out where plants stand idle, because the problem at 7 pm is timing, fuel cost, and wires — not megawatts on paper.
The evening pile-up
Demand over a day is not flat. It rises in the morning, dips midday, and climbs again as people get home: lights on, cooking started, air conditioners still running, shops open, offices not yet wound down. For a few hours, every type of consumer draws at once.
That pile-up is the peak. A grid has to meet it second by second — there is no warehouse of electricity to draw on. Generation must match consumption in real time, or frequency falls and the system sheds load to protect itself. So the peak, short as it is, sets the size of much of the system: plant, fuel, and transmission enough to survive a few hard hours, even if that capacity sits lightly used the rest of the day.
The numbers show how lopsided that bargain is. According to NEPRA's State of the Industry Report 2025, covering fiscal year 2024–25, demand peaked at just over 33,000 MW while installed capacity stood at 41,212 MW. A system built for a peak lasting hours, carrying plants that then stand idle, is expensive by construction — and under take-or-pay contracts, idle plants still get paid.
Solar leaves just as demand arrives
Rooftop solar changed the shape of the day. In daylight it cuts what the grid has to supply — a genuine relief: in summer 2025, the power minister credited solar net metering with keeping daytime load shedding at bay while LNG supplies were disrupted.
But solar output falls to zero at sunset, right when household demand climbs. The grid gets a steep ramp: solar drops away, evening load rises, and other plants must pick up both at once. The Tribune reported that growing solar penetration had eased daytime demand but shifted the burden to evening hours. The minister put the shortfall then at 3,400 MW, with load management concentrated in the night peak hours, and net-metering capacity at up to 8,000 MW. Those are his figures, from a press briefing, not metered system data — but the shape he described is real.
The duck curve
The shape has a name. Engineers call it the duck curve, and it plots net load, not demand. Net load is what dispatchable plants must actually supply: total demand minus whatever solar and wind are producing at that moment. The rest of the system does not see demand; it sees net load.
Through the day the two curves separate. In the morning they track together. At midday, solar output is high and net load sags — the belly of the duck. Then the sun sets and the curves snap back together: solar falls to zero over an hour or two, right as evening demand climbs, and net load ramps steeply into the night peak. That steep section is the neck, and it is the hardest part of the day to operate — harder than the peak itself, because the problem is speed, not size.
Speed matters because plant cannot follow instantly. A steam turbine ramps at a limited rate, measured in megawatts per minute, and it has a minimum stable load below which it cannot run. Turn it down too far at midday and it must shut down; start it again for the evening and it needs hours, not minutes. Run it part-loaded through the belly and its heat rate worsens — more fuel per unit, the same penalty described in the heat-rate post. Batteries and fast gas engines exist largely to cover this neck: they can move in minutes where steam plant needs hours.
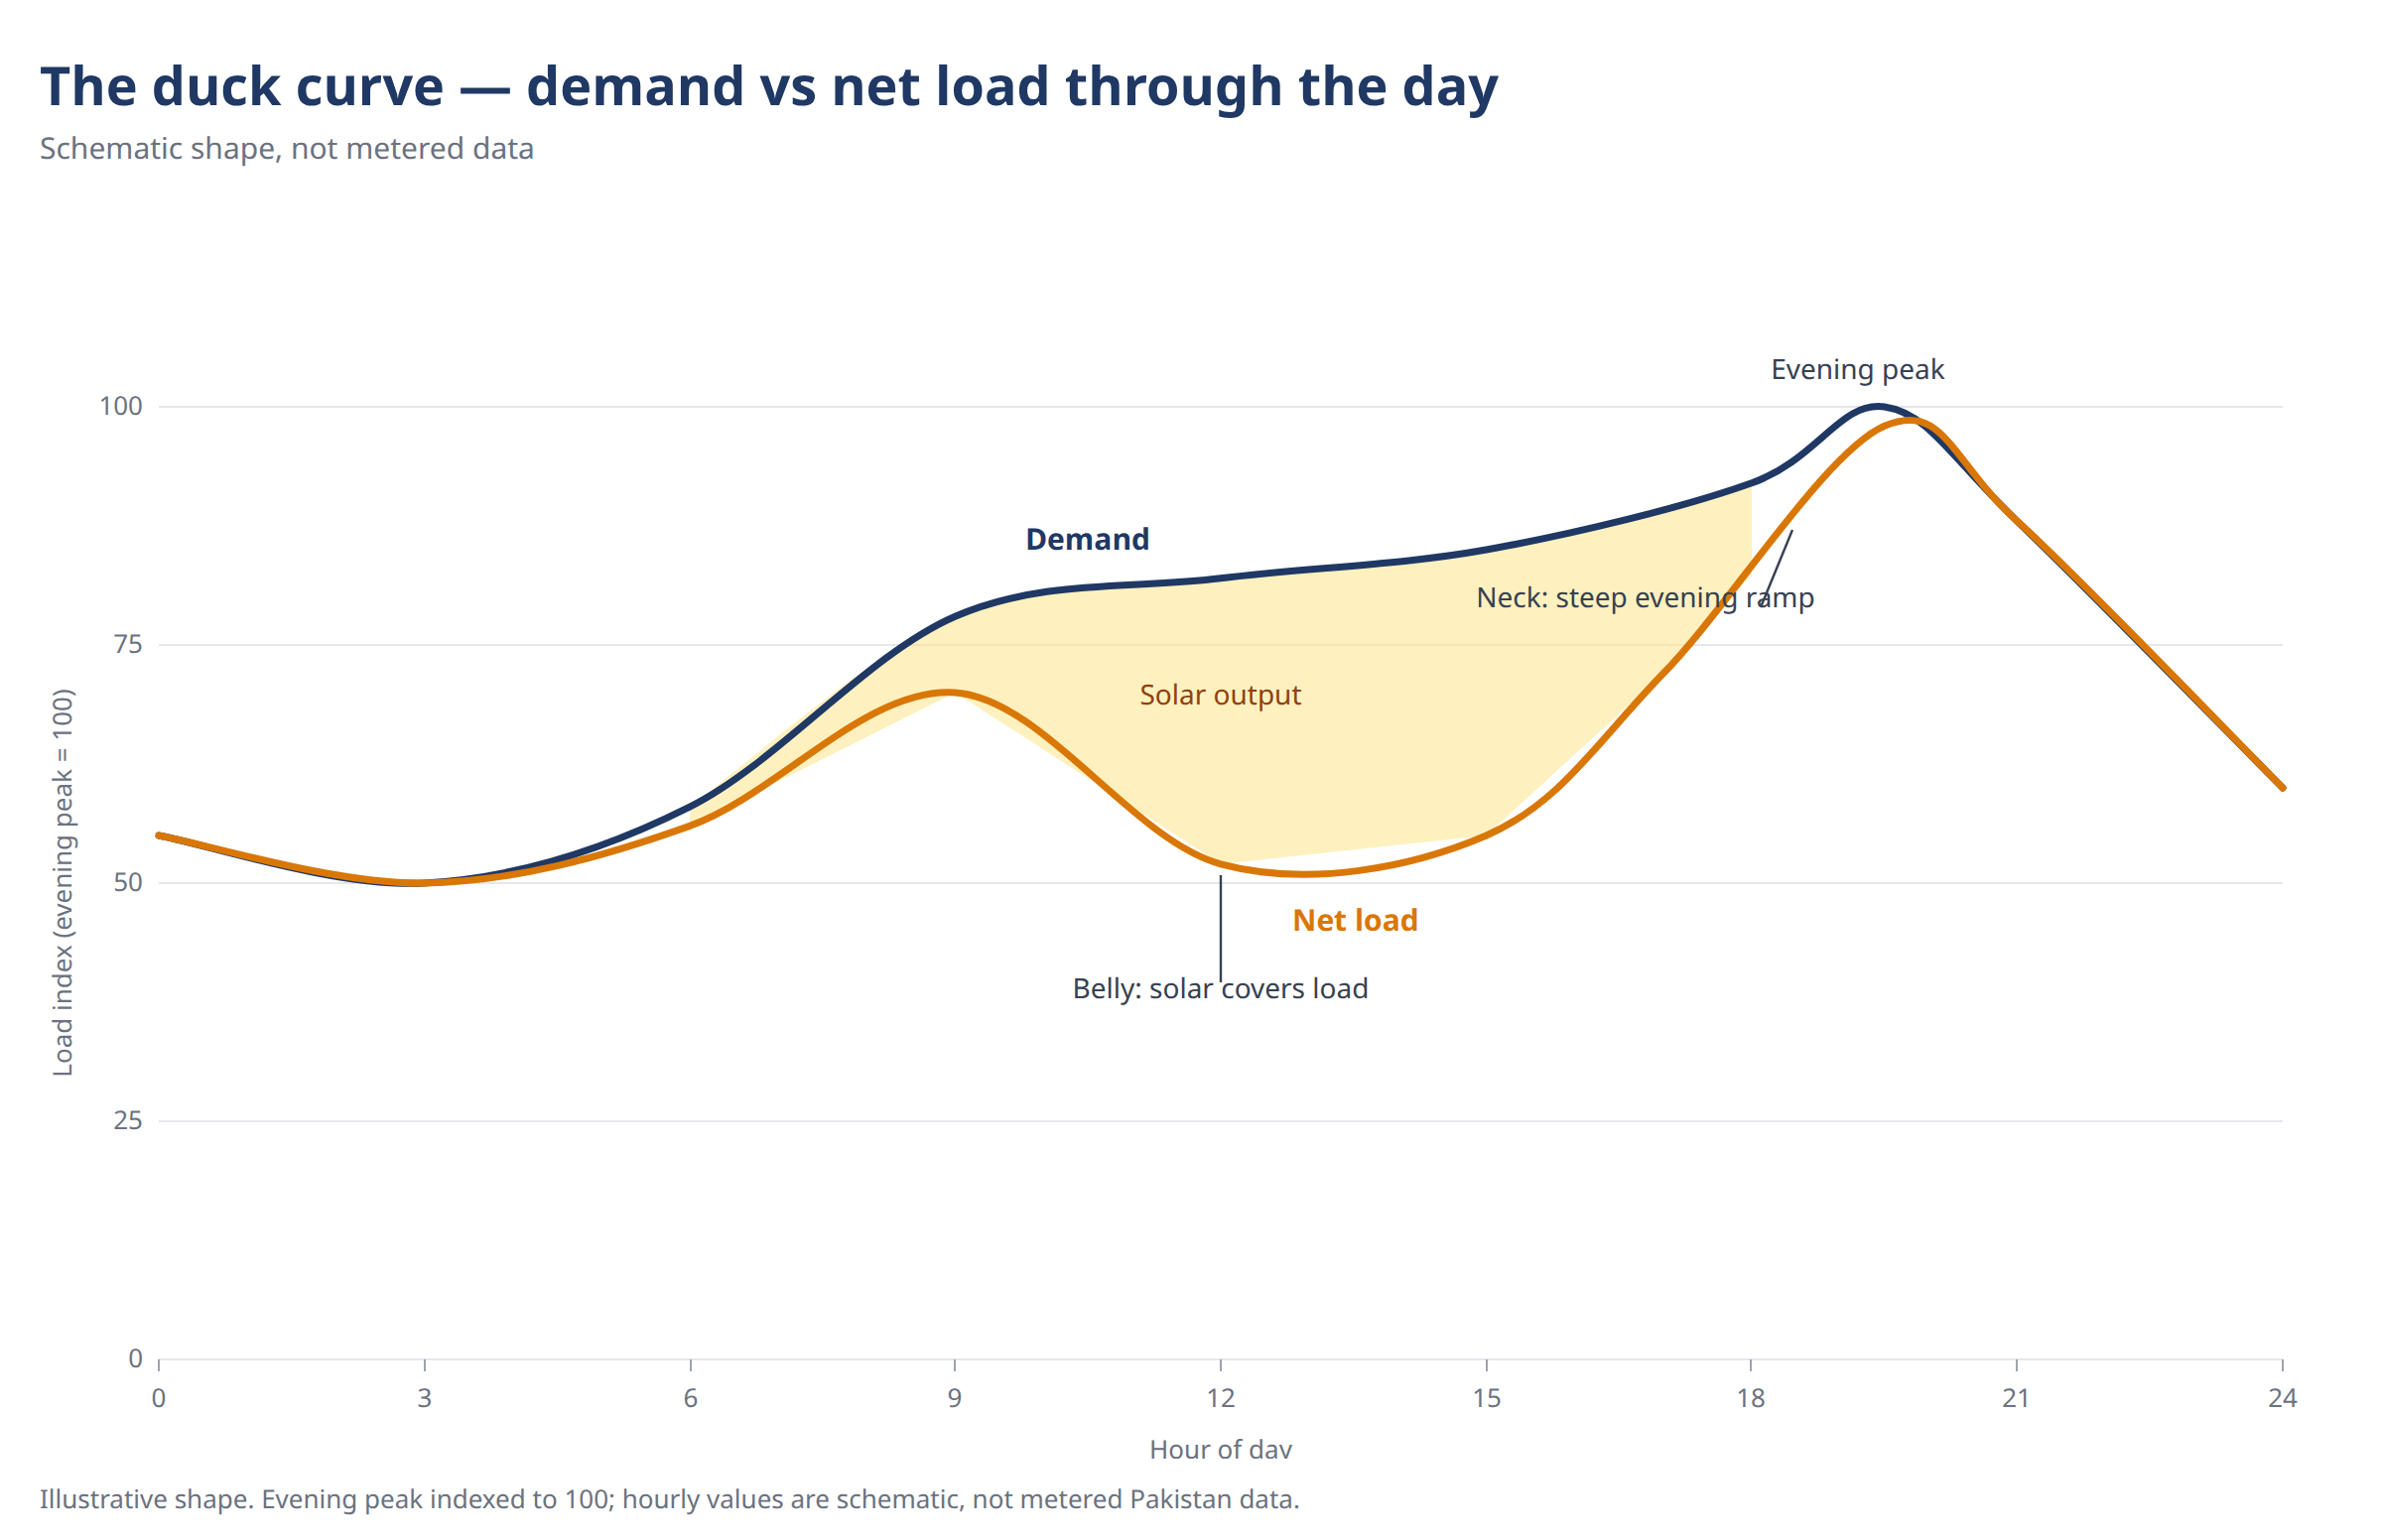
Figure: the duck curve, schematic. Demand and net load (demand minus solar and wind) through the day. The midday belly is solar covering load; the neck is the steep evening ramp as solar falls away. Shape is illustrative, not metered Pakistan data; the peak figure in this post (just over 33,000 MW) is from NEPRA's State of Industry Report 2025.
Why spare capacity does not save the evening
If installed capacity exceeds peak demand, why cut anyone off? Three reasons.
First, installed capacity is not available capacity. Plants are on maintenance, short of fuel, or limited by water for hydro. In that same summer 2025 briefing, the minister said gas supply to most LNG-based plants had been suspended, leaving only about 500 MW of roughly 6,000 MW running on alternative fuel, with hydel output also down. A nameplate number means little when the fuel is not there.
Second, the wires constrain what can move. NEPRA's 2025 report notes that transmission congestion stops cheap electricity from efficient plants reaching consumers. A cheap plant behind a congested line does not help a city at 7 pm.
Third, the marginal megawatt at peak is the most expensive one. Once low-cost hydro, nuclear, and efficient thermal plants are fully loaded, the next units to start are the dear ones: furnace oil and imported gas. That ordering has a name, the merit order: cheapest plant first, dearest last, and at peak the system is buying from the dear end of it. Running them for a few hours pushes up the system's average cost, and that lands in tariffs. Peak management is often a price decision dressed up as a technical one.
Pakistan made that trade-off explicit in April 2026, when the Power Division announced daily load shedding of two hours and fifteen minutes between 5 pm and 1 am as a "peak-hours relief strategy", to limit expensive fuels and avoid a sharp tariff rise; officials said prices could otherwise have risen by Rs 5 to Rs 6 per unit. Households experienced it as an outage; the operator, as a choice between an outage now and a higher bill later.
What actually flattens a peak
There is no single fix, because a peak is not a single cause. The measures that work fall into four groups.
Shift demand, where it can move. Heavy, flexible loads — water pumping, charging, some industrial processes, pre-cooling a building — do not have to run at 7 pm. Time-of-use tariffs, where they exist, reward that shift by pricing evening electricity closer to its true cost. The Power Division's suggestion in April 2026, early closure of commercial markets, was the same idea in cruder form.
Store the daytime surplus. A battery charged from solar during the day and discharged in the evening does what the grid cannot: it moves energy across hours. At household scale that is solar-plus-storage; at grid scale it is the same logic, bigger and dearer, and still the missing piece in most systems. Charged in the belly, discharged through the neck — storage is the one asset that moves energy across the hours the duck curve creates.
Fix the wires and the losses. NEPRA's 2025 report put combined transmission and distribution losses for public utilities at about 16.4 per cent, against an allowed limit of 11.77 per cent. Every unit lost in the wires has to be generated and paid for, then never billed. Cutting losses shrinks the peak the system has to serve.
Stop building only for the peak. Sizing the whole system for a few hours a year guarantees idle capacity and high capacity payments. The cheaper path is a mix: enough firm capacity for a credible peak, flexible plant and storage for the ramp, and demand-side measures to take the top off.
The Takeaway
The grid's hardest job is not producing enough electricity in a day, but producing the right amount in the right hour, at a price people can pay. Anything that moves load out of the evening window, stores daytime energy for the evening, or cuts losses helps more than another plant that will also stand idle at noon. Check your own evening load first — what runs between 5 pm and 9 pm, and what could run earlier or later.
Further Reading
Solar net-billing calculator — Work out what solar plus storage does to your own evening import, on the site's calculator.
Heat Rate: The Number That Decides a Plant's Tariff — Why a few points of efficiency move millions, and how tariffs carry those costs.
Power sector mired in inefficiency: Nepra — The News report on NEPRA's State of the Industry Report 2025, source of the 33,000 MW peak and 41,212 MW installed-capacity figures and the 16.4 per cent losses figure.
Pakistan announces 2.25-hour daily loadshedding during peak hours — The Power Division's April 2026 peak-hours relief strategy: 2 hours 15 minutes daily between 5 pm and 1 am, and the Rs 5–6 per unit rise officials said it aimed to avoid.
Solar net metering helps avert daytime outages — The Tribune's account of the summer 2025 evening crunch, including the minister's 3,400 MW shortfall figure and the shift of pressure to hours after sunset.
More from the blog
 ProjectsHow Owners Evaluate Bids — Inside a Techno-Commercial EvaluationA bid that passes pre-qualification, a technical read of the method, prices normalised to one basis and a whole-life view may still not be the cheapest — but it will be the one you can defend, to a board, an auditor, and the plant that has to live with it.Read post →
 MaintenanceMinor at 30K, Major at 60K — The Rhythm of Engine OverhaulsAn engine wears out on hours, not dates. The 30,000-hour minor is a checkpoint whose measurements shape the 60,000-hour major — and across a 32-engine fleet, sequencing, spares and records are what make the programme work.Read post →
 MaintenanceVibration Analysis for Beginners: What the Spectrum Is Telling YouAn overall vibration number says how much a machine shakes, not why. The spectrum splits the shaking into frequencies — 1× for unbalance, 1× plus 2× with high axial readings for misalignment, a forest of harmonics for looseness, off-grid peaks for bearing defects — and phase settles the cases that look alike.Read post →