Maintenance
Reading a Pump Curve Without Guessing
Read a pump curve in order: head against flow, efficiency and the 70%–120% band, power at duty and runout, suction head, and the system curve.
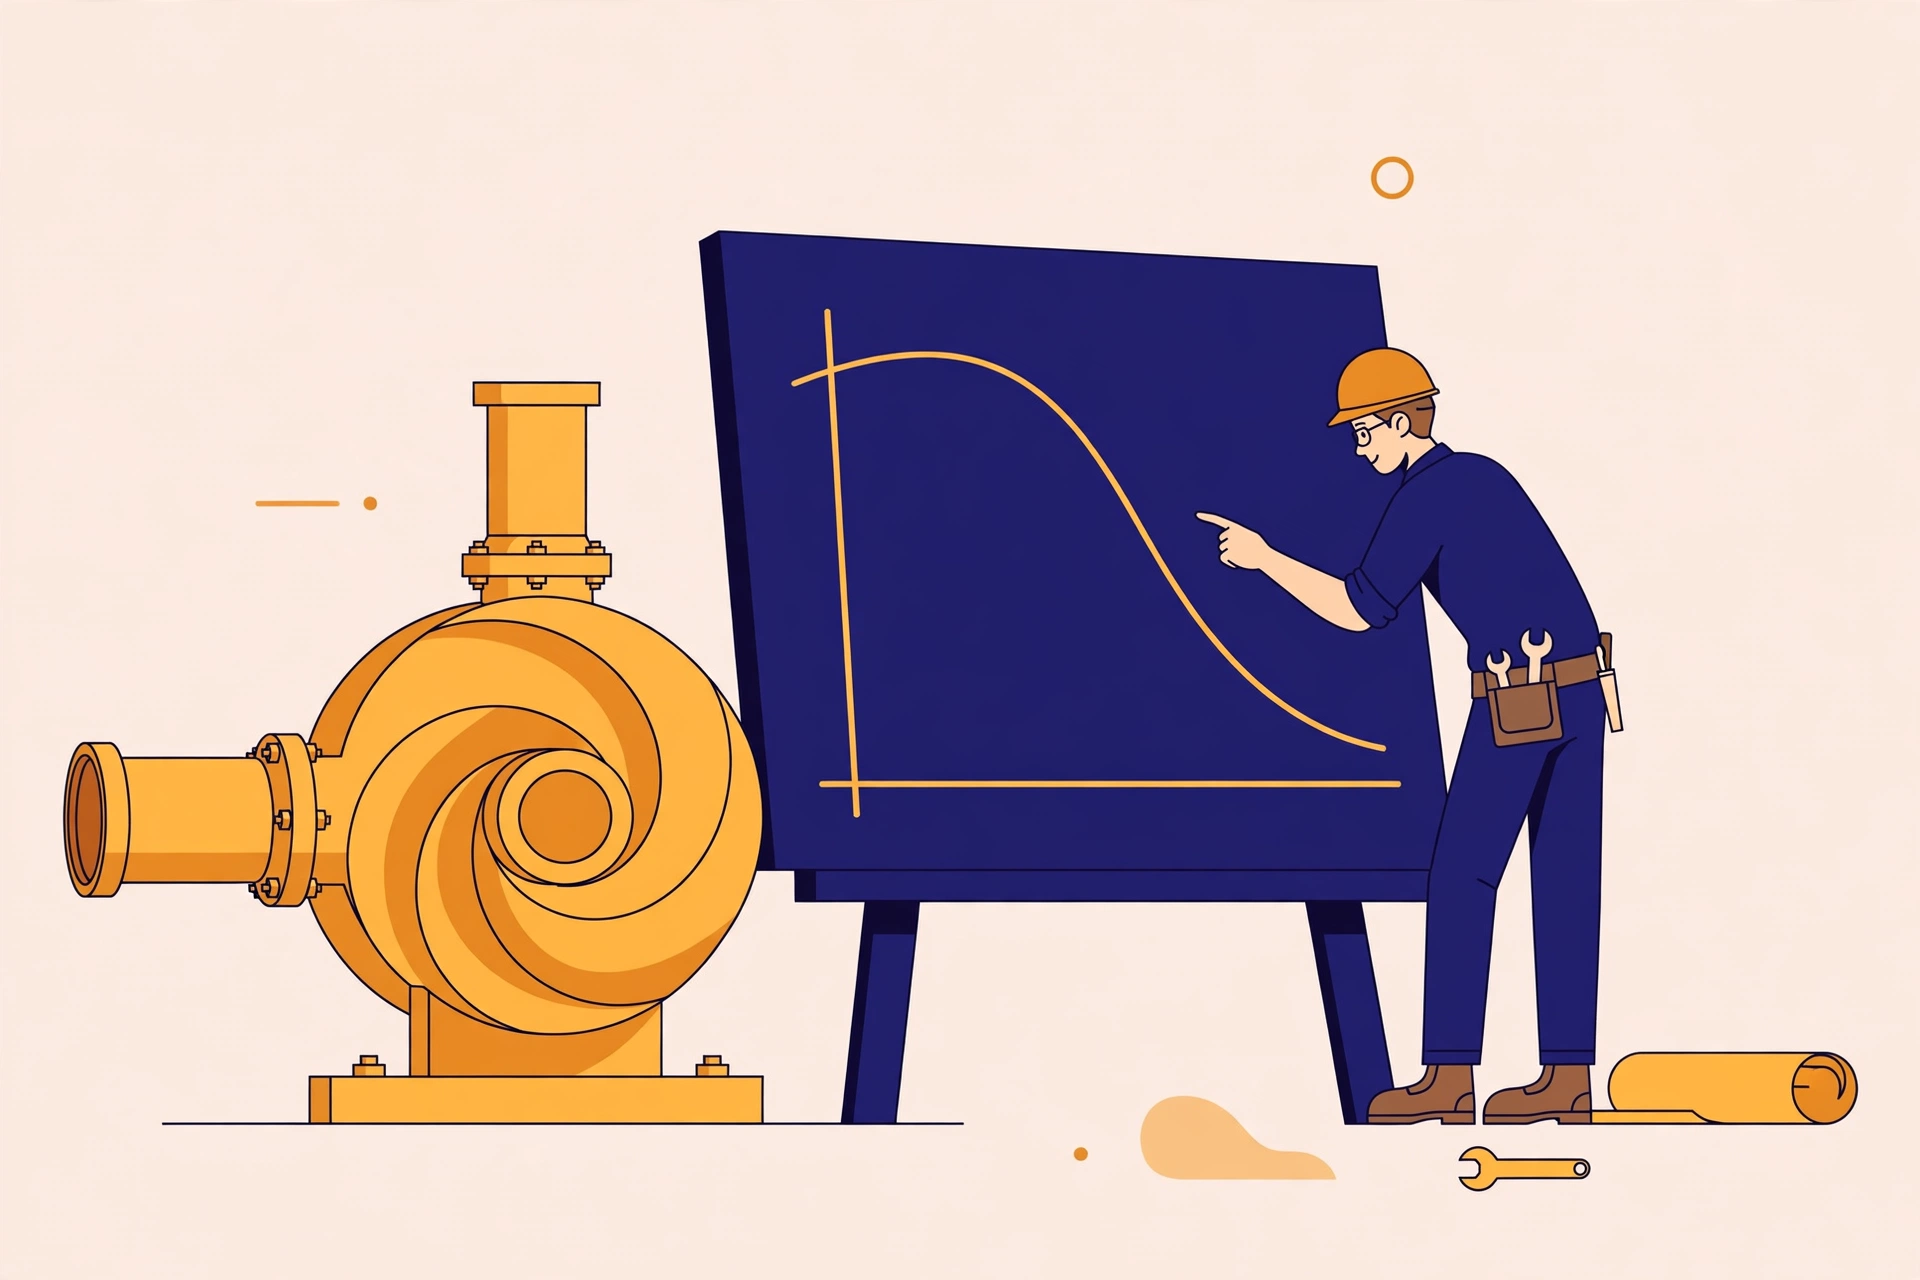
A pump data sheet can look like a tangle of lines: head, flow, efficiency, power, suction head, sometimes for four impeller sizes at once. Most people find the flow they want and stop there. That is how pumps end up running too far left or too far right of where they should, drawing more power than they need and wearing out sooner than they should.
Read it in order: the main curve first, then efficiency, then power, then suction head. Each line answers a different question.
Start with head against flow
The main curve slopes down from left to right. Flow sits on the horizontal axis, usually in cubic metres per hour or litres per second. Head sits on the vertical axis, usually in metres.
Head is not pressure, though the two are linked: it is the height the pump can lift the liquid, as a column of that liquid. It stays the same whether you pump water or something heavier; pressure does not, because it depends on density. That is why curves are drawn in head.
At zero flow, with the discharge shut, the pump makes its highest head: shutoff head. As flow rises, head falls, until the curve ends at runout — the most flow the pump can push, at the lowest head it can manage. Neither end is a place to run for long: shutoff churns the same liquid and heats the pump, runout vibrates it and strains the motor.
If the sheet shows several curves close together, those are different impeller diameters for the same casing; a smaller impeller drops the whole curve down. Check which line you are actually on before reading anything off it — reading the full-size curve for a trimmed impeller makes a pump look far more capable than it is.
Find the best efficiency point, then stay near it
The efficiency curve rises, peaks, and falls as flow increases. Its peak is the best efficiency point, or BEP, where the pump converts the most input power into useful pumping, with the least recirculation and vibration.
Running exactly at BEP is rarely possible, so what matters is the band around it. The Hydraulic Institute defines a preferred operating region of 70% to 120% of the flow at BEP for most centrifugal pumps. Inside that band, efficiency stays close to its peak and wear stays low. Outside it, too far left means internal recirculation, heat, and shaking; too far right means cavitation, vibration, and excess power.
So the first real question about any pump is not "can it reach my flow?" It is "does my flow sit inside the preferred region?" A pump that reaches your duty at the edge of its curve is a worse choice than one that puts your duty near its BEP.
Check power before you check the motor
The power curve tells you what the pump shaft needs at each flow. On most centrifugal pumps it rises with flow, so size the motor for the highest flow the pump could actually see, rather than only the duty point. A motor sized exactly at the duty point will overload the first time the system lets the pump run out, a valve opened wider than planned.
Read the power curve at runout as well as at duty. If power at runout exceeds the motor rating, the pump needs a larger motor, a trimmed impeller, or a control arrangement that keeps it from running out.
Suction head is where cavitation lives
The NPSH required curve — NPSHr — shows the suction head the pump needs at each flow to avoid cavitation, rising steeply at the right-hand end. Your system has to supply more: the NPSH available at the inlet, NPSHa, must stay above NPSHr with margin at every flow the pump will see.
Cavitation is what happens when it does not. Pressure at the impeller eye drops below the liquid's vapour pressure, bubbles form, then collapse violently at higher pressure — a rattling, gravel-like noise. Left alone, it eats the impeller and destroys seals and bearings, and it signals a pump running too far right on its curve or suction conditions changed: a lower tank level, a hotter liquid, a blocked strainer.
Note the direction of the check: NPSHa is a property of your system — tank level, suction losses, liquid temperature — while NPSHr is a property of the pump. Work out NPSHa for the installation at its worst credible conditions, not its normal ones.
The pump curve alone does not give you the operating point
Here is the part people skip. A pump curve shows what the pump *can* do, not what it *will* do in your system. That comes from the system curve: the head your pipework, static lift, and fittings demand at each flow. Where the two curves cross is the operating point, and it slides along the pump curve whenever the system changes — a valve opened, a pipe fouled, a tank raised.
Throttling a discharge valve moves the operating point left along the curve, wasting energy across the valve, while trimming the impeller or slowing the pump with a variable-speed drive moves the pump curve itself. With a speed change, the affinity laws apply: flow in proportion to speed, head with the square of speed, power with the cube. Slow a pump by a little and power falls a lot — which is also why a drive that "nearly" makes the duty often does not, since head falls faster than flow.
One caution: published curves are normally for clean water at a stated speed and impeller size, so check whether they apply before trusting a reading for any other liquid.
The Takeaway
Read a pump curve in this order, every time: head against flow, on the impeller line you are actually on; efficiency, for the best efficiency point and the 70%–120% band around it; power at duty *and* at runout against the motor rating; suction head required against what your system actually supplies; and finally the system curve, whose intersection with the pump curve is where the pump will really run. Five checks, and the sheet becomes a straight answer: will this pump, in this system, run where it runs best?
Further Reading
Preventive, Predictive, Condition-Based — Choosing the Right Mix — How to decide what each asset actually gets, so a pump's running position is part of a maintenance plan rather than an accident.
Plant maintenance — pillar guide — The full guide to maintenance planning, where pump checks sit alongside overhauls, inspections and budgeting.
Getting the Most Out of Your Pumps: Reading and Understanding the Centrifugal Pump Performance Curves — Wilo's pump-basics guide, source for the Hydraulic Institute preferred operating region of 70% to 120% of BEP flow and for the NPSHr and power-curve explanations.
Pump curves — Grundfos's short reference on head, flow and efficiency curves, including parallel and series pump combinations.
More from the blog
 ProjectsHow Owners Evaluate Bids — Inside a Techno-Commercial EvaluationA bid that passes pre-qualification, a technical read of the method, prices normalised to one basis and a whole-life view may still not be the cheapest — but it will be the one you can defend, to a board, an auditor, and the plant that has to live with it.Read post →
 MaintenanceMinor at 30K, Major at 60K — The Rhythm of Engine OverhaulsAn engine wears out on hours, not dates. The 30,000-hour minor is a checkpoint whose measurements shape the 60,000-hour major — and across a 32-engine fleet, sequencing, spares and records are what make the programme work.Read post →
 EnergyWhy the Grid Struggles at 7 pm: Peak Demand, ExplainedThe evening peak is not a shortage of plants. It is a timing problem: demand climbs as solar falls away, and the system must ramp faster than its slowest plant can move — buying the last megawatts from the dear end of the merit order.Read post →