Energy
Pakistan's Energy Mix in Five Charts — What Changed in Five Years
Pakistan built more power capacity in five years and generated less electricity. Five charts show why, with every figure sourced.
Pakistan built a lot of power station capacity in five years and generated less electricity. That one fact explains more about the country's energy bills than any new plant announcement.
Between 30 June 2020 and 30 June 2024, total installed capacity rose from 38,719 MW to 45,888 MW, according to NEPRA's State of the Industry reports. That is 7,169 MW more plant, an 18.5% increase. Over the same period, generation went the other way. NEPRA's national totals were 133,727 GWh in FY2020 and 143,091 GWh in FY2021, but the figure published in the Pakistan Economic Survey 2023-24 for FY2023 was 128,963 GWh. More plant, less power. The rest of this post shows why, in five charts, with every number sourced at the end so you can check it yourself.
One warning before the charts. Pakistan's energy numbers come in different coverages, and mixing them up is the easiest way to get fooled. Some totals include K-Electric, some do not. Some cover a full year, some cover nine months. I have kept the coverages stated next to each figure, and the charts compare like with like. When a comparison is not like for like, the caption says so.
1. The gap between capacity and power delivered
Start with the gap. NEPRA's State of the Industry Report 2024 put total installed capacity at 45,888 MW on 30 June 2024, including K-Electric, with average annual utilisation of only 33.88%. In NEPRA's own words, consumers ended up paying for 66.12% of unutilised capacity.
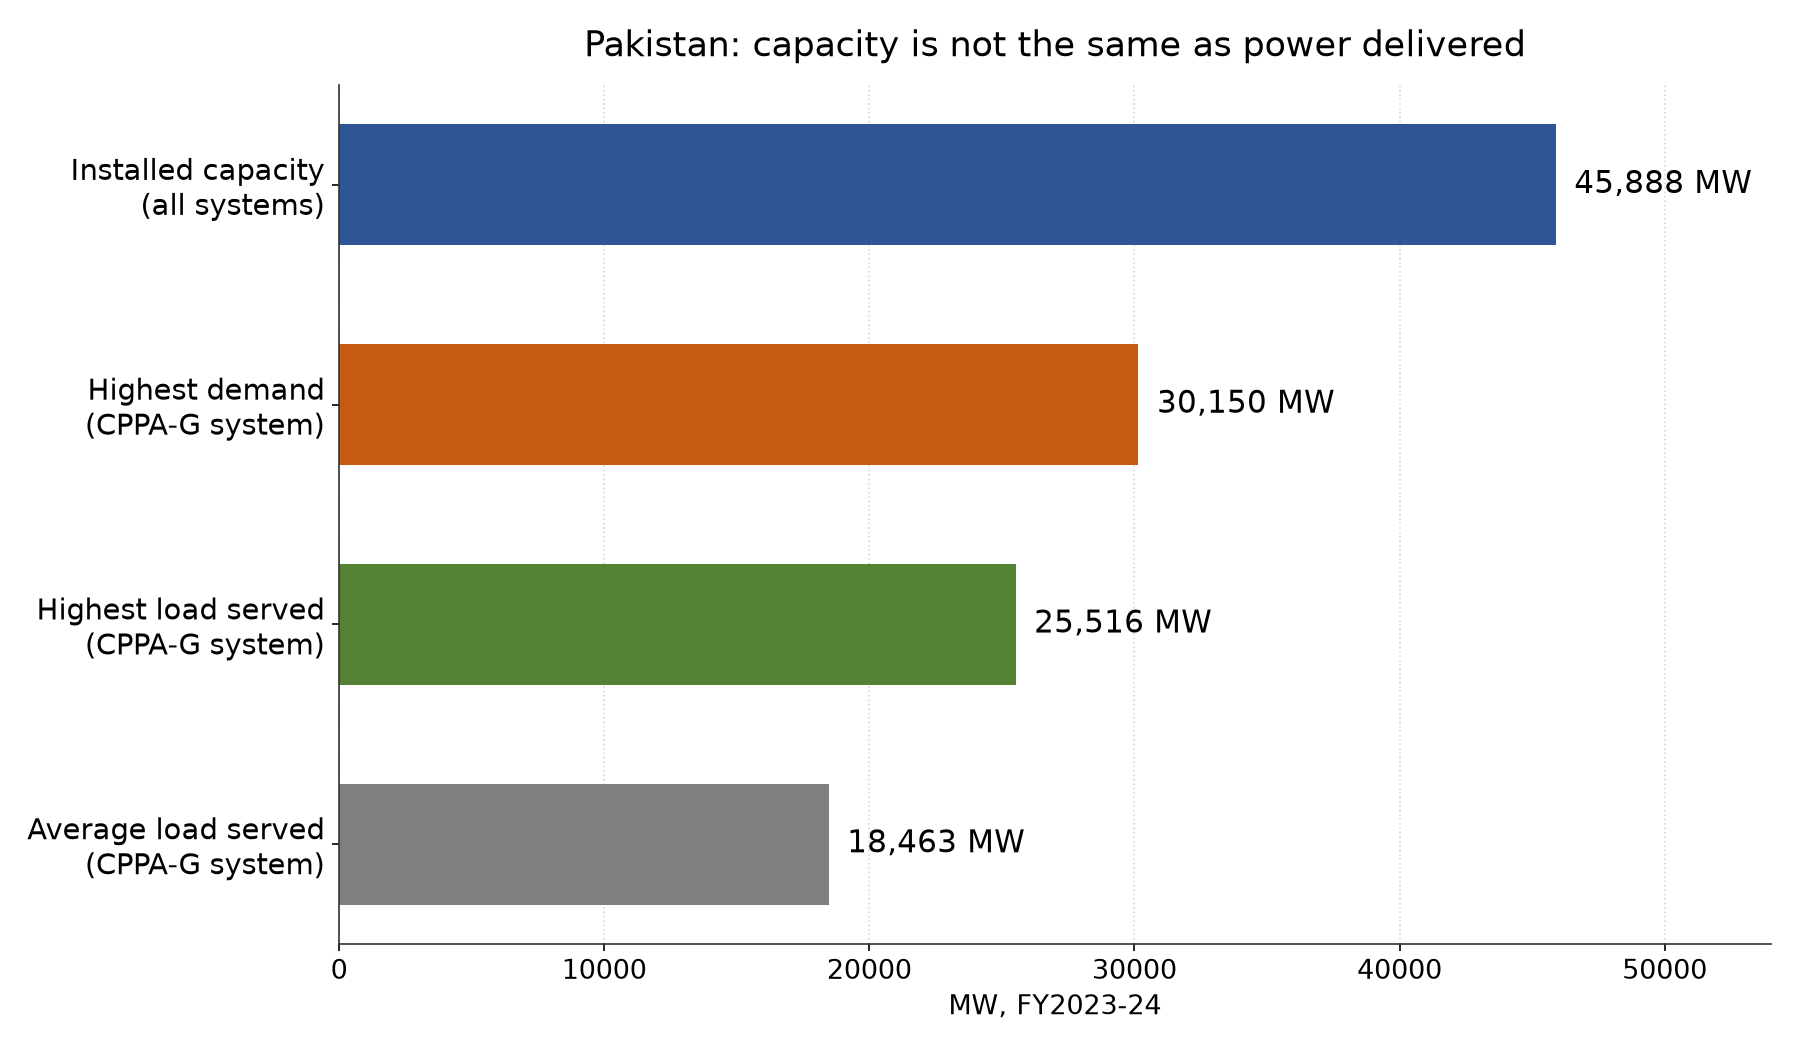
Figure: installed capacity (all systems) against CPPA-G maximum demand, maximum load served and average load served, FY2023-24. Source: NEPRA State of the Industry Report 2024, as reported by Business Recorder, 31 December 2024. The installed figure covers all systems including K-Electric; the demand and served figures cover the CPPA-G system only, so the bars are not a like-for-like balance. They show the scale of the gap between plant on paper and power delivered.
Look at the CPPA-G system on its own, because that is where most of the country sits. At the close of FY2023-24 it had 42,512 MW of installed capacity, and maximum demand of 30,150 MW. But the most it ever actually served was 25,516 MW, and the average load served through the year was 18,463 MW. Demand itself swings a long way, from a minimum of 7,015 MW to that 30,150 MW peak, so the system is built for a peak it touches briefly and then runs well below it for most of the year. The rest of the plant is idle, on maintenance, short of fuel, or stuck behind transmission limits. Under take-or-pay contracts, idle plant still gets paid, and that fixed bill is spread over fewer and fewer units sold.
The same report put circular debt at PKR 2.39 trillion on 30 June 2024, with defaulters owing PKR 900.82 billion and total receivables of all distribution companies at PKR 2.32 trillion. That debt is not one bad year. It is the running total of a system that keeps adding fixed costs while the units it sells stay flat or fall.
2. The mix did move, just not the way the word transition suggests
The generation mix did shift. The honest way to show it is to compare the same nine months in both years, because the Economic Survey is published mid-year and its first edition of the numbers covers July to March. On that like-for-like basis, thermal fell from 58.4% of generation in July–March FY2020 to 45.88% in July–March FY2024. Nuclear more than doubled, from 8.2% to 18.19%. Hydro barely moved, from 30.9% to 31.67%. Grid renewables, wind, solar and bagasse together, rose from 2.4% to 4.26%.
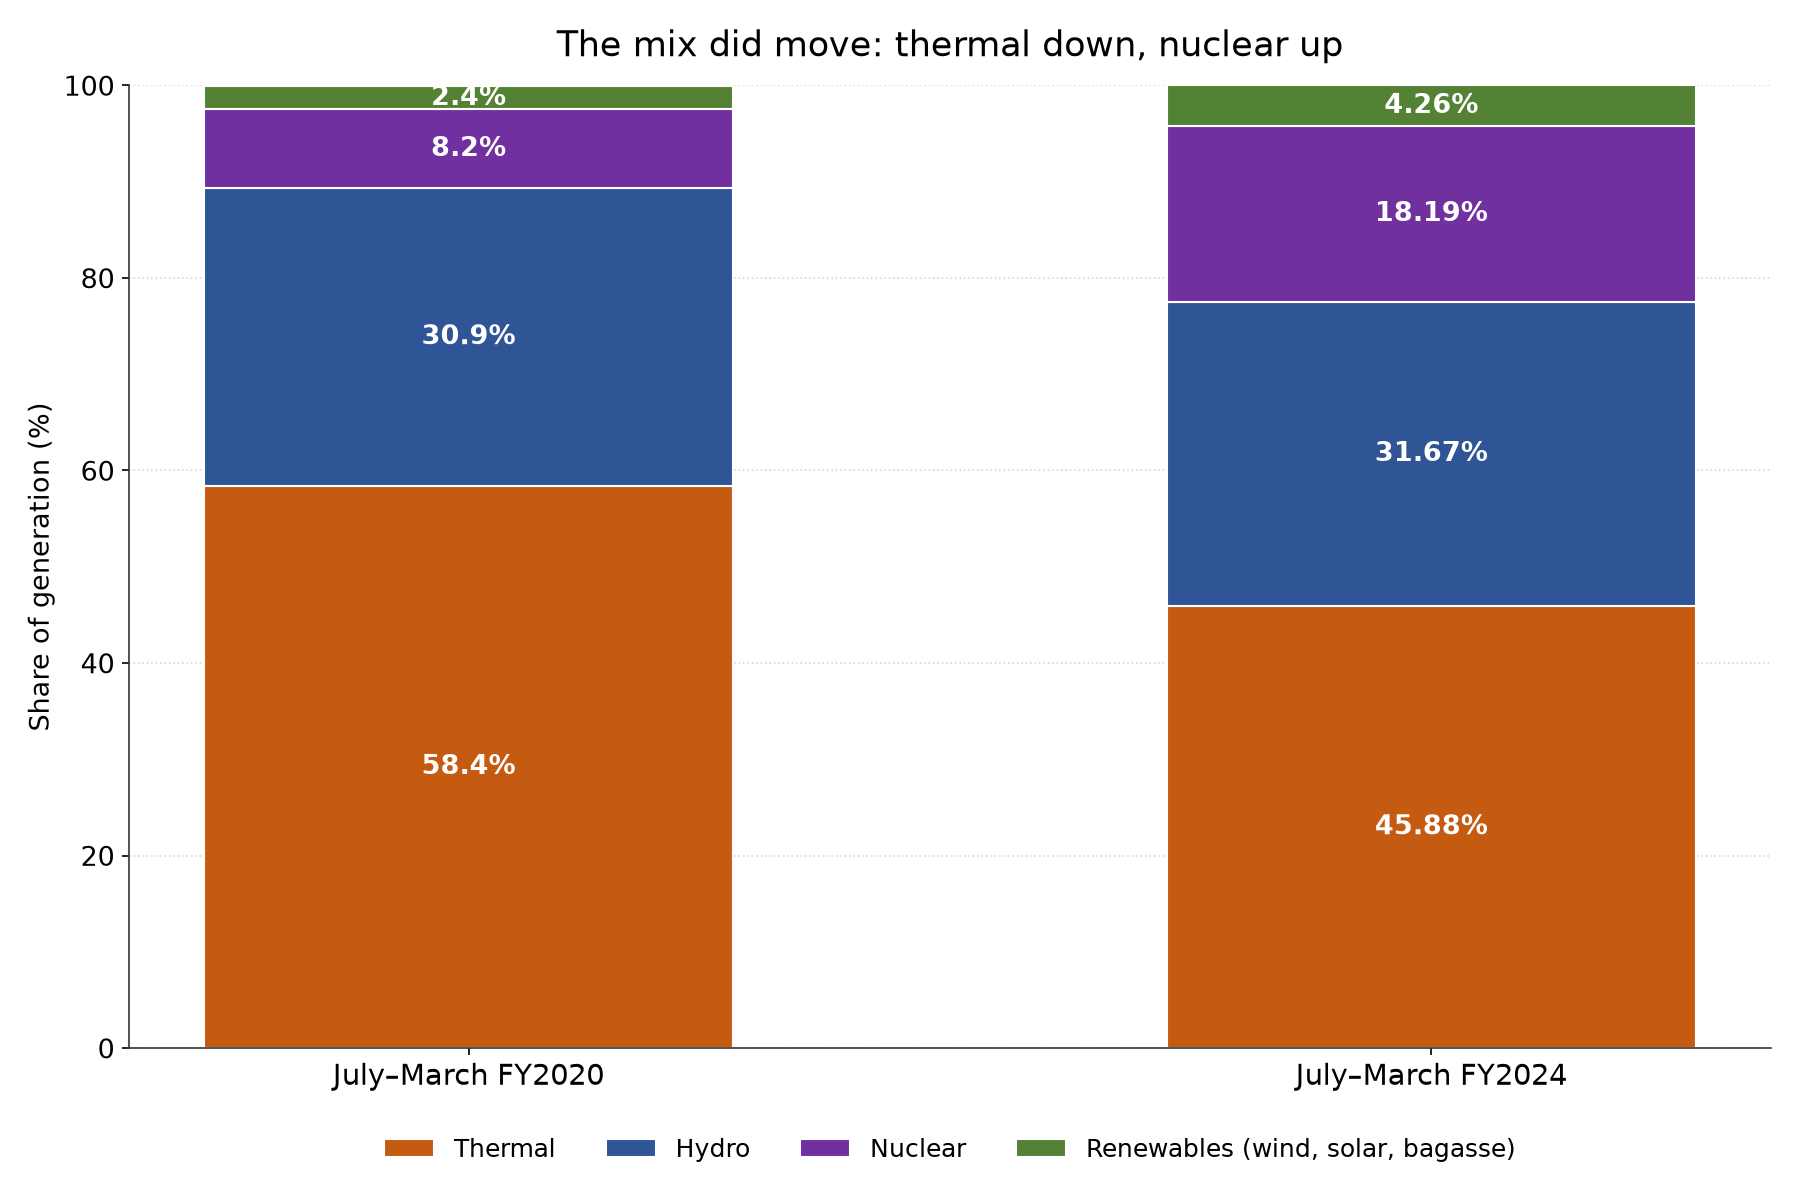
Figure: generation mix, July-March FY2020 against July-March FY2024. Source: Pakistan Economic Survey 2019-20 (July-March shares, as reported 12 June 2020) and Pakistan Economic Survey 2023-24, Table 14.2 (NEPRA data). Both bars are nine-month slices, so the comparison is like for like.
Nuclear is the quiet driver. The 2019-20 Survey reported five nuclear plants totalling 1,430 MW gross. By March 2024 there were six, totalling 3,545 MW, according to the 2023-24 Survey. New reactors pushed a large block of low-running-cost, must-run generation into the dispatch order, ahead of thermal plant. Dispatch works on merit order: cheapest running cost first, dearest last. Every unit taken by nuclear or hydro is one a thermal plant does not sell, and with total demand flat, the pie did not grow to make room for everyone.
Hydro's flat share hides its own mechanism. Output follows river flows and seasons, not demand. In a good water year it displaces expensive thermal; in a dry stretch it cannot. A share of roughly 31% is a weather average, not a firm floor, and anyone planning around it as if it were firm will be caught out.
For the full year FY2023, the Survey's Table 14.2 gives the same picture in absolute terms: 128,962.7 GWh in total, of which thermal 62,639 GWh (48.57%), hydro 36,254.8 GWh (28.11%), nuclear 24,054.6 GWh (18.65%) and renewables 6,014.3 GWh (4.66%).
3. Who holds the capacity, and who actually generates
This is the chart energy professionals should look at first, because it shows the dispatch order in numbers. In July–March FY2024, thermal held 59.45% of installed capacity but produced only 45.88% of generation. Nuclear held 8.41% of capacity and produced 18.19% of generation. Hydro held 25.35% of capacity and produced 31.67%. Renewables held 6.79% of capacity and produced 4.26%.
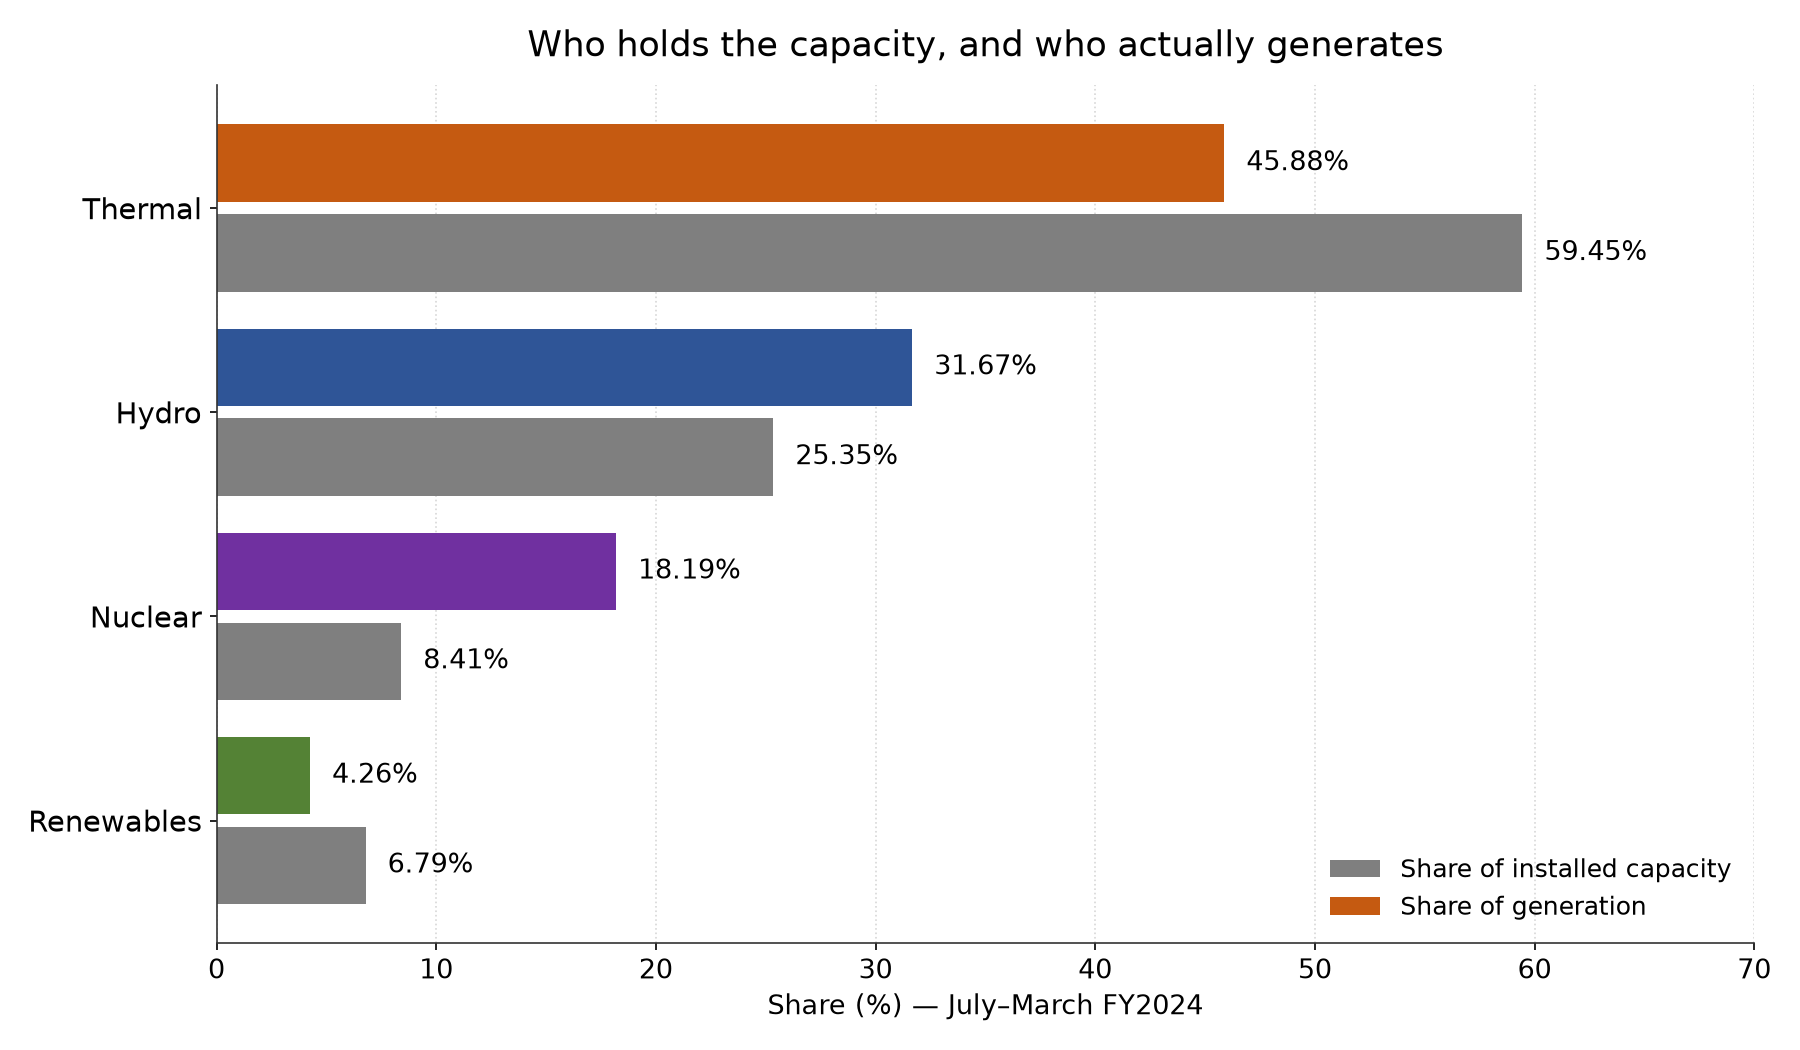
Figure: share of installed capacity against share of generation, by source, July-March FY2024. Source: Pakistan Economic Survey 2023-24, Tables 14.1 and 14.2 (NEPRA data). Thermal holds most of the capacity and makes less than half the power; nuclear holds little capacity and makes nearly a fifth of the power.
Read it as a story about running hours. Nuclear runs almost all the time, because it must run and its fuel cost per unit is low, so a small share of capacity gives a large share of generation. Hydro runs when the water is there. Thermal is left with what remains, which is the middle and the peak, and it often runs part-loaded. That matters because a steam plant at half load burns more fuel per unit than at full load. This is the heat-rate penalty, and it is why cutting thermal's share without cutting its fixed costs squeezes from both ends: fewer units sold, and each unit costs more fuel to make.
Then add the fixed costs. A plant under a take-or-pay contract earns its fixed cost whether it runs or not. When nuclear and hydro take the base of the load curve, thermal plants sell fewer units but still collect their capacity payments. The fixed bill per unit sold goes up, and that is exactly what shows up in tariffs and in circular debt. The problem is not that Pakistan built too much plant in some abstract sense. It is that it built plant under contracts that pay for availability, while demand stayed flat and cheaper must-run plant took the running hours.
4. Where the power, and the money, leaks
Generation is only half the story. What reaches a paying customer is less, and the difference is where a large part of the debt comes from. NEPRA's 2024 report put transmission and distribution losses at 18.31% for FY2023-24, against an allowed 11.77%. That excess added PKR 276 billion to circular debt in the year. Recovery of billed amounts was 92.44%, and the shortfall added another PKR 314.51 billion.
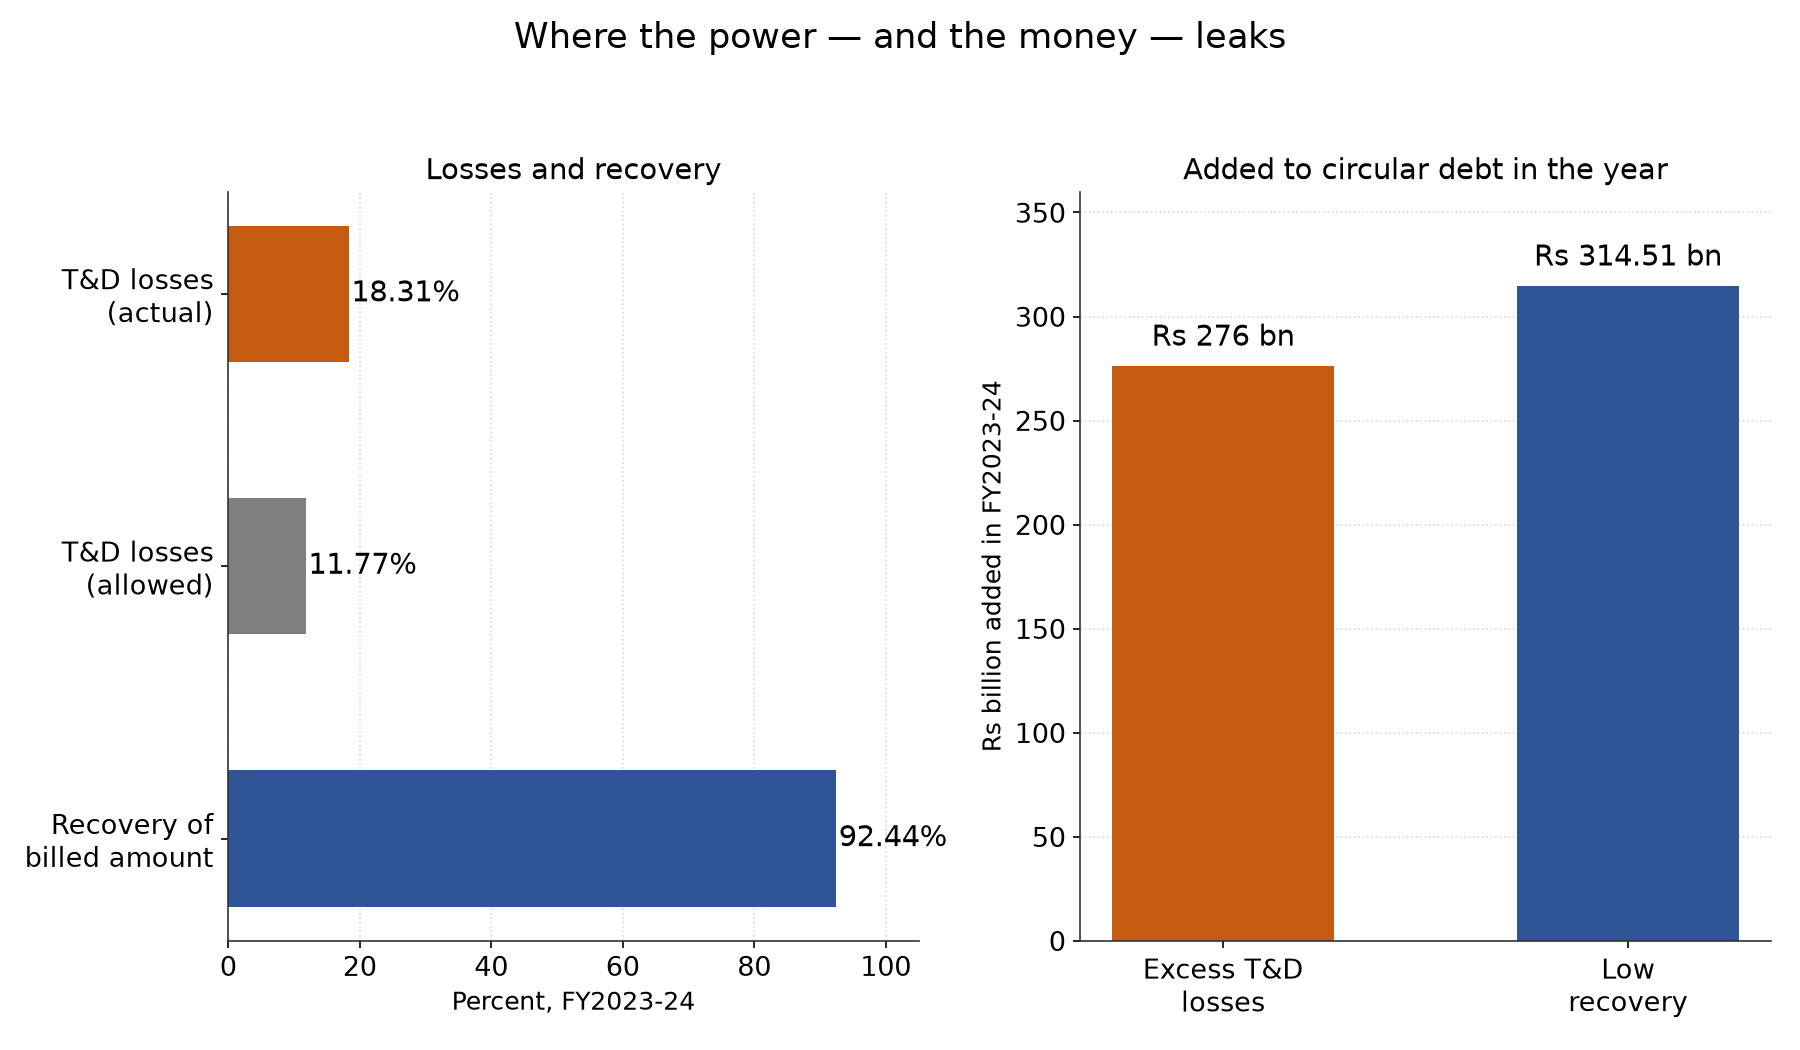
Figure: transmission and distribution losses against the allowed level, recovery of billed amounts, and what each added to circular debt in FY2023-24. Source: NEPRA State of the Industry Report 2024, as reported by Business Recorder, 31 December 2024.
Every unit lost or unbilled has to be paid for by the units that are billed, which is why tariffs keep rising even as the generation mix gets cleaner on paper. And the customer base itself is shifting. Households are now the largest consumers, taking 49.2% of consumption in July–March FY2024, while industry's share fell to 26.3%. In absolute terms, industrial consumption in the nine months fell from 19,626 GWh to 18,022 GWh, about 8% down. Industry is either using less, generating its own power, or leaving the grid. All three mean fewer paying units to carry the same fixed bill, and the remaining customers, mostly households, carry more of it.
5. The solar the official mix barely shows
Here is the part the official generation table misses, and it is the fastest-moving part of the whole story. Grid renewables were still only 4.66% of generation in FY2023. Yet solar, counted properly, has become one of the largest sources in the country. The difference is counting, not contradiction.
Grid statistics count electricity that passes through the grid's meters. A rooftop system that powers its own building never passes through those meters. It shows up as lower demand, not as generation. So the official mix can report renewables at under 5% while rooftops spread across whole industrial estates. Ember, the energy think tank, estimates solar supplied about 20% of Pakistan's electricity in 2025, up from roughly 3% at the start of the decade, as reported by Bloomberg and Business Recorder in October 2026. That estimate uses a different counting method, it includes distributed solar the grid statistics do not, and it covers a different year, so it should not be pasted next to the NEPRA shares as if both measured the same thing.
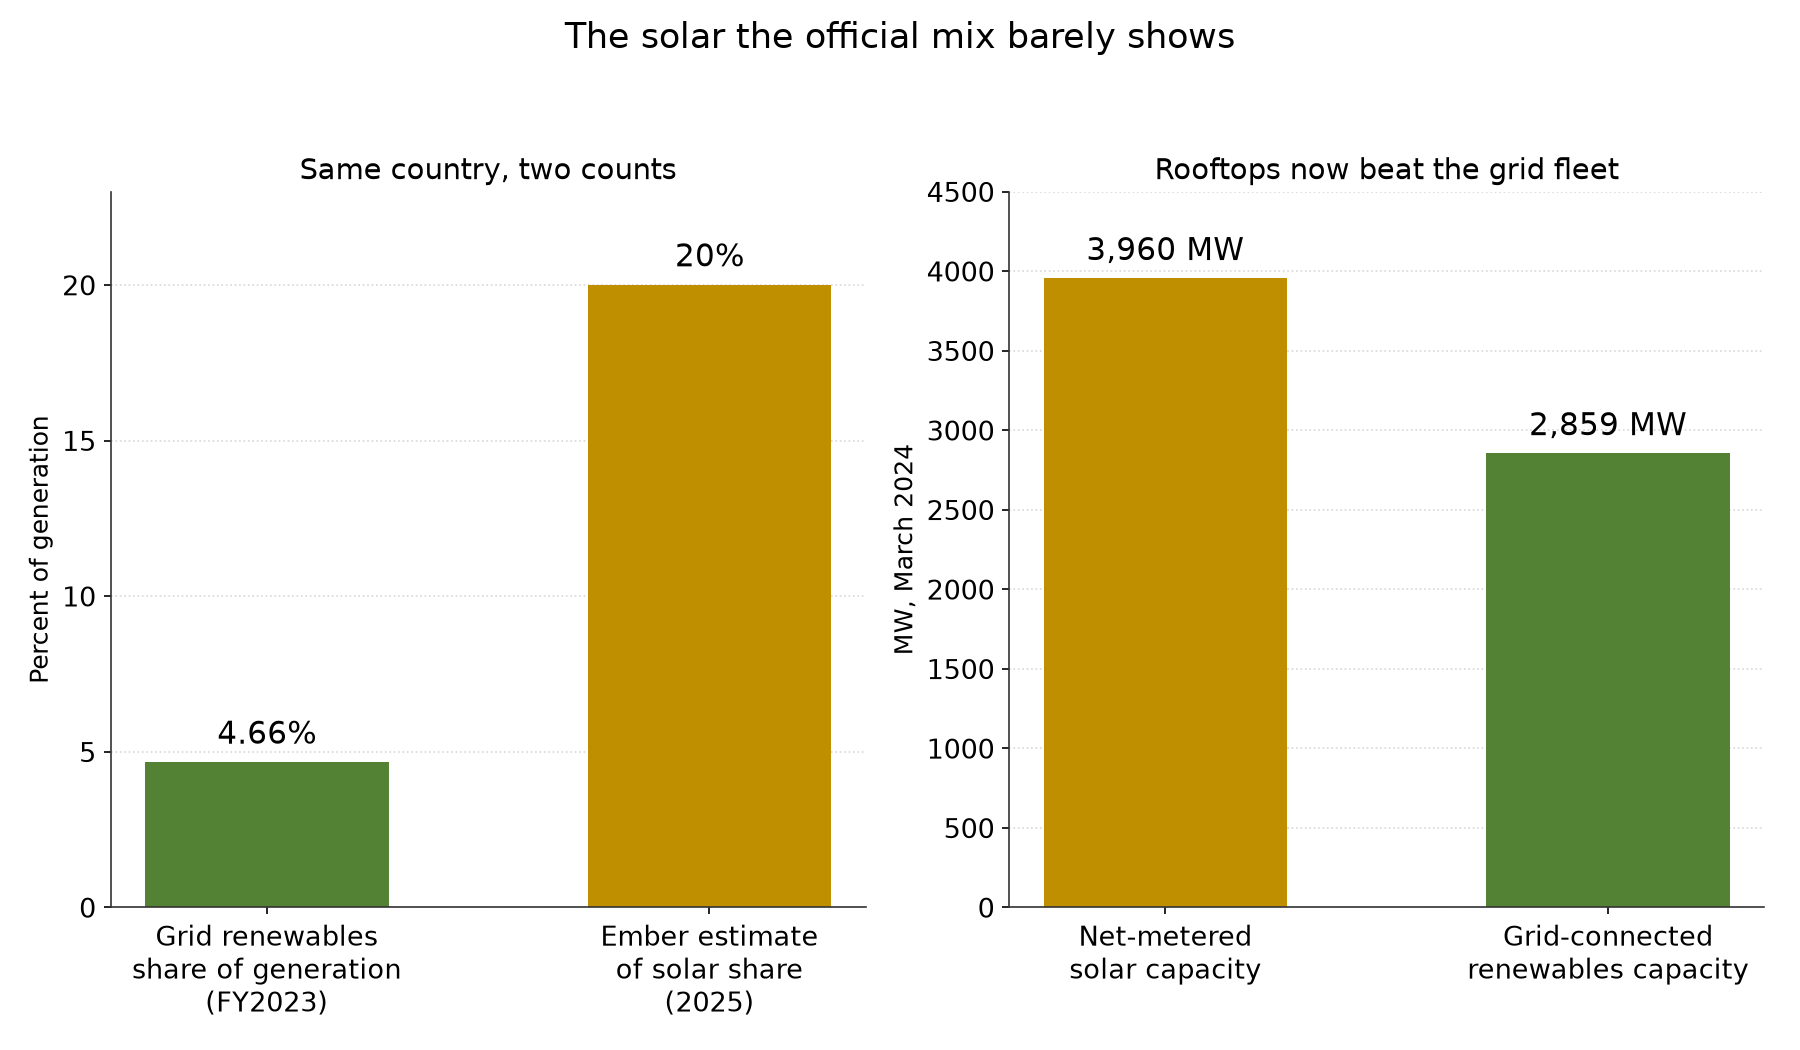
Figure: left, grid renewables as a share of generation (FY2023) against Ember's estimate of solar's share (2025). The two use different counting methods and different years, so they are not a like-for-like comparison. Right, net-metered solar capacity against grid-connected renewables capacity, March 2024. Sources: Pakistan Economic Survey 2023-24, Tables 14.1 and 14.2; Ember via Business Recorder, October 2026.
What makes the Ember figure believable is not the estimate itself but the hard number behind it. The 2023-24 Survey records 117,807 net-metering solar installations with a cumulative capacity of 3,960 MW as of March 2024. That is registered, grid-connected rooftop solar alone, and it already exceeds the entire grid-connected renewables fleet of 2,859 MW in the same month. Add the unregistered rooftops that never touch the net-metering scheme, and the direction is clear. The same report, citing NEPRA data, put distribution-company electricity consumption almost 12% lower in the twelve months to July 2025 than three years earlier. Demand did not vanish. It moved behind the meter, and every unit that moves takes its share of the fixed bill with it, leaving the grid's remaining customers to pay more per unit.
What to watch
Three things will decide whether the next five years look different. First, hydro: the 884 MW Suki Kinari project was over 96% complete in March 2024 and due to come online in November 2024, according to the Survey, and it would add a large block of seasonal must-run-style generation. Second, the pipeline: the Private Power and Infrastructure Board was processing 12 ongoing IPPs totalling 1,563 MW for 2024–26. Third, and most important, demand: whether industry comes back to the grid, and whether net-metering keeps growing faster than the grid fleet. If demand stays flat while must-run and rooftop capacity keep growing, thermal plants will run less, part-load penalties will grow, and the fixed bill per unit will keep rising no matter how clean the mix looks on a chart.
The Takeaway
I have spent fifteen years around power plants, and the number I look at first is not capacity. It is utilisation, and then what was actually billed. When you read any energy-mix chart for Pakistan, check five things before accepting its headline. Is it capacity or generation, megawatts on paper or megawatt-hours actually produced? Does the total include K-Electric or not? Is it a full year or a nine-month slice? Does it count behind-the-meter solar, or only what the grid metered? And what share of what was generated was lost or unbilled before it reached a paying customer? A mix that looks cleaner on generation shares can still be expensive if capacity sits idle, thermal runs part-loaded, and a fifth of output never gets billed. The mix that matters is the one measured at the meter, after losses, at the hour people actually need power.
Further Reading
Solar net-billing calculator — Work out what rooftop solar plus storage does to your own grid import, on the site's calculator.
Heat Rate: The Number That Decides a Plant's Tariff — Why part-load running raises fuel cost per unit, and how that lands in tariffs.
Pakistan Economic Survey 2023-24, Chapter 14: Energy — The Survey's energy chapter, source of the FY2023 generation shares (Table 14.2), the capacity table (Table 14.1), the consumption table (Table 14.3), the net-metering figure and the IPP pipeline.
Surge in capacity drives up electricity production cost, NEPRA report reveals — Business Recorder's report on NEPRA's State of the Industry Report 2024, source of the 45,888 MW capacity, 33.88% utilisation, demand and served-load, losses and circular-debt figures.
Pakistan's solar boom adds pressure on Chinese-backed coal plants: report — Business Recorder's account of the Bloomberg report, source of the Ember solar estimate (about 20% in 2025, from roughly 3% at the start of the decade) and the NEPRA-based fall in distribution-company consumption.
Sources
Every statistic in this post comes from one of the following. Where a figure is reported second-hand, the report carrying it is named alongside the original publisher.
1. NEPRA, State of the Industry Report 2024, as reported by Business Recorder, 31 December 2024 — installed capacity 45,888 MW (30 June 2024, including K-Electric), utilisation 33.88%, consumers paying for 66.12% of unutilised capacity, CPPA-G capacity 42,512 MW, maximum demand 30,150 MW, minimum demand 7,015 MW, maximum load served 25,516 MW, average load served 18,463 MW, circular debt PKR 2.39 trillion, defaulters PKR 900.82 billion, distribution-company receivables PKR 2.32 trillion, transmission and distribution losses 18.31% against 11.77% allowed (PKR 276 billion added), recovery 92.44% (PKR 314.51 billion added). Business Recorder, 31 December 2024
2. NEPRA, State of Industry Report 2020-21 — total installed capacity 38,719 MW (30 June 2020, including CPPA-G and K-Electric systems), total generation 133,727.2 GWh (FY2020) and 143,090.64 GWh (FY2021). NEPRA presentation, copy on SlideShare
3. Pakistan Economic Survey 2023-24, Chapter 14: Energy (NEPRA data) — Table 14.1 installed capacity (FY2023 total 41,981 MW; March 2024 total 42,131 MW, by source), Table 14.2 generation (FY2023 total 128,962.7 GWh by source; July–March FY2023 total 93,111.2 GWh; July–March FY2024 total 92,091.0 GWh by source), Table 14.3 consumption (FY2023 total 112,891.2 GWh by sector; July–March FY2024 total 68,559 GWh), net-metering installations 117,807 with 3,960 MW cumulative capacity (March 2024), six nuclear plants totalling 3,545 MW, Suki Kinari 884 MW hydro over 96% complete (March 2024, due November 2024), 12 ongoing IPPs totalling 1,563 MW (2024–26), 100 IPPs facilitated totalling 24,958 MW. Pakistan Economic Survey 2023-24, Chapter 14
4. Pakistan Economic Survey 2019-20, as reported by The News and The Express Tribune, 12 June 2020 — July–March FY2020 generation shares (thermal 58.4%, hydro 30.9%, nuclear 8.2%, renewables 2.4%) and generation in GWh (thermal 51,629, hydro 27,270, nuclear 7,049, renewables 2,057), installed capacity 35,972 MW (April 2020), five nuclear plants totalling 1,430 MW gross. The News, 12 June 2020 and The Express Tribune, 12 June 2020
5. Ember, as reported by Bloomberg and Business Recorder, October 2026 — solar about 20% of Pakistan's electricity in 2025, up from roughly 3% at the start of the decade; distribution-company electricity consumption almost 12% lower in the twelve months to July 2025 than three years earlier (NEPRA data). Business Recorder, October 2026
More from the blog
 ProjectsHow Owners Evaluate Bids — Inside a Techno-Commercial EvaluationA bid that passes pre-qualification, a technical read of the method, prices normalised to one basis and a whole-life view may still not be the cheapest — but it will be the one you can defend, to a board, an auditor, and the plant that has to live with it.Read post →
 MaintenanceMinor at 30K, Major at 60K — The Rhythm of Engine OverhaulsAn engine wears out on hours, not dates. The 30,000-hour minor is a checkpoint whose measurements shape the 60,000-hour major — and across a 32-engine fleet, sequencing, spares and records are what make the programme work.Read post →
 EnergyWhy the Grid Struggles at 7 pm: Peak Demand, ExplainedThe evening peak is not a shortage of plants. It is a timing problem: demand climbs as solar falls away, and the system must ramp faster than its slowest plant can move — buying the last megawatts from the dear end of the merit order.Read post →